Analytics module: drive your scheduling with data
Dashboards, KPIs, and automated reports to manage your schedules with precision.
Data-driven scheduling
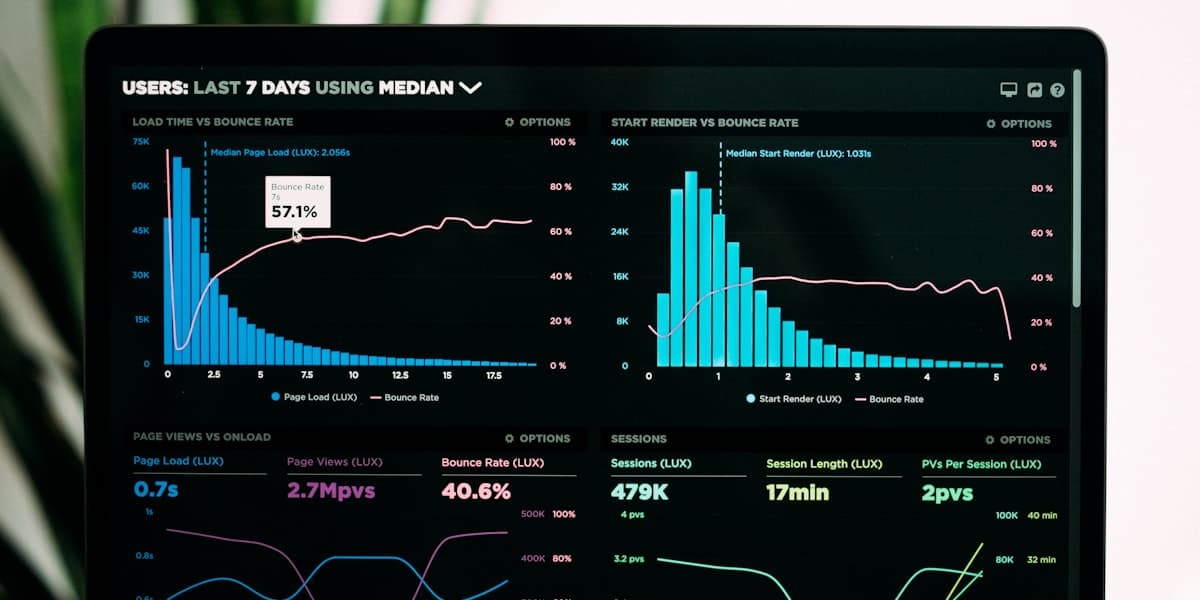
Orkelis's new Analytics module transforms your scheduling data into actionable insights. Coverage rates, hourly costs, overtime, distribution fairness: every KPI is calculated automatically and presented in clear dashboards.
Real-time dashboards
Three main views: operational view (daily and weekly coverage), managerial view (monthly KPIs by team), and executive view (multi-site consolidation with trends). Each view is customizable with drag-and-drop widgets.
Automated reports
Schedule automatic report delivery by email: weekly reports for managers, monthly reports for executives, compliance reports for HR. Reports are generated as PDFs with your up-to-date data.
Proactive alerts
Set alert thresholds on any KPI. Example: alert if overtime exceeds 5% of total volume, or if coverage rate drops below 95% on a given day. You're warned before the problem escalates.
Optimize your schedules with Orkelis
Try our intelligent scheduling solution for free and save time every week.
Stay informed
Get our guides and scheduling news straight to your inbox.
Related articles
Continue reading with these articles.

Orkelis API: integrate scheduling into your tools
The Orkelis REST API lets you integrate intelligent scheduling into any information system.

New Orkelis mobile app: your schedule in your pocket
The Orkelis mobile app is completely redesigned: offline viewing, one-tap swaps, smart notifications.

Athena 2.0: the AI scheduling engine shifts into high gear
Discover the new capabilities of the Athena engine: predictive scheduling, continuous learning, and multi-objective optimization.